
Ex – 13.2 Que No. 1
Q.1) The following table shows the ages of the patients admitted in a hospital during a year:
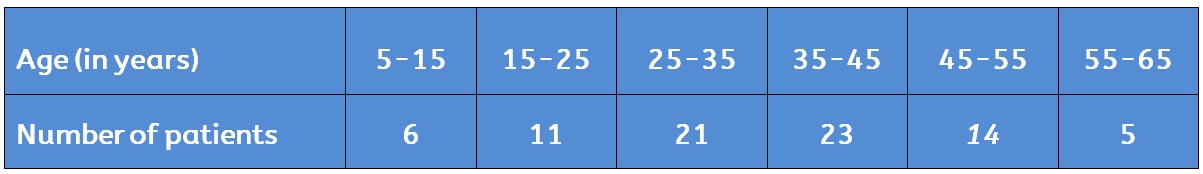
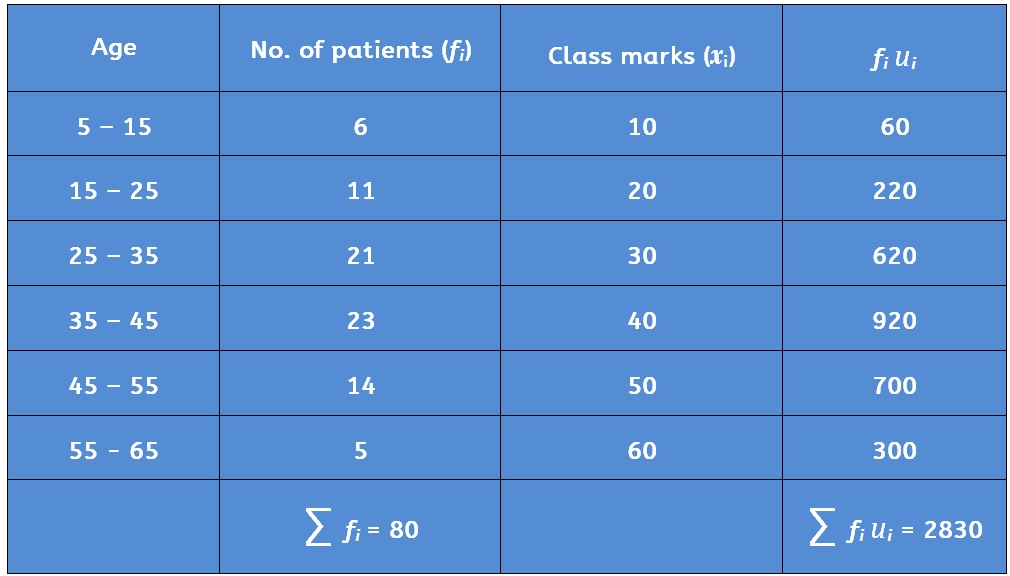
Find the mode and the mean of the data given above. Compare and interpret the two measures of central tendency.
Solution:-
Find the mode and the mean of the data given above. Compare and interpret the two measures of central tendency.
Solution:-